Article #5 of a 7 Part Series
Modern brain studies apply non-invasive imaging methods to explore many forms of information handling by multiple parts of the brain.
Patients with brain injuries continue to contribute a great deal to understanding of brain mechanisms, but modern imaging studies confirm that all not aspects of a patient’s missing capability are managed solely by the brain area with obvious damage.
These techniques are expanding knowledge of how multiple brain areas work together in infants learning language for the first time, how blindness alters brain neuron circuitry for touch and hearing, and how the visual centers of the human brain respond to temporary blindness of cataracts and how it recovers with return of sight.
Five brain imaging techniques dominate studies to discover patterns of brain circuit activity devoted to specific tasks. Each method has its own advantages and limitations. Non-invasive imaging methods include:
- Event Related Potentials (ERPs) of an EEG
- Magnetic Resonance Imaging (MRI)
- Functional Magnetic Resonance Imaging (fMRI)
- Magnetoencephalography (MEG)
- Functional Near Infrared Spectroscopy (fNIRS)
Electroencephalogram (EEG)
Brain neurons are believed never to operate in isolation. Rather, they perform as members of organized groups called neuron circuits. The various types of neurons within a neuron circuit act synchronously. Ion flow within the circuit of neurons creates a pattern of local electrical field fluctuations that can be measured.
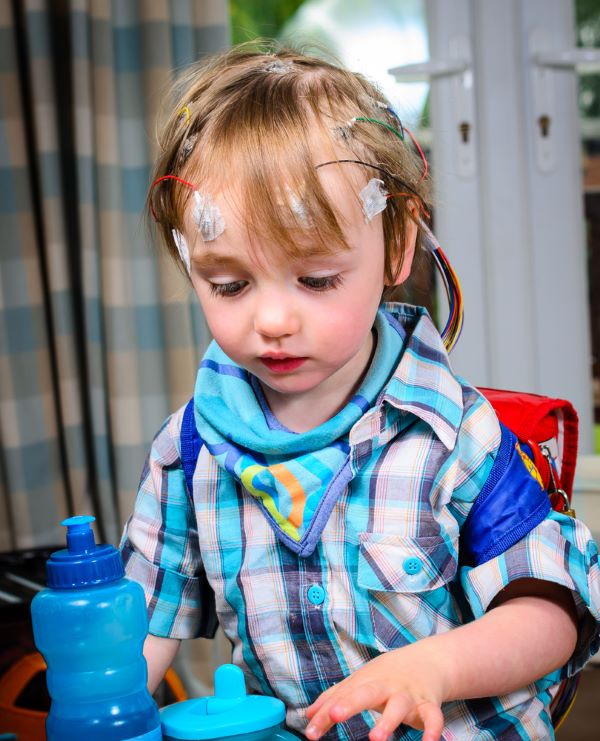
Electrodes placed on the head record the shifts in the brain’s local field potentials. Voltage measurements, the difference in local field potential between pairs of scalp electrodes, produce an oscillatory recording over time named an electroencephalogram, or EEG for short. An EEG records the coincident activity of millions of neurons at a time.
With event-related potentials (ERPs), the electrical activity measured by scalp electrodes is time-locked to presentation of a sensory stimulus, a picture or a spoken word.
ERPs are especially sensitive to voltage changes due to neuron activity in the outer layer of brain cells, the cerebral cortex which is just beneath the skull.
This method is often used to study the regions of the cerebral cortex dedicated learning language by children. ERP/EEG is inexpensive compared to the other techniques. Yet, there is a good association between exposure to a stimulus and measurement of the responding neuron activity.
Being noiseless, it is also a good method for studies of brain areas involved in processing sound. Its major drawback is its sensitivity to movement.
Magnetic Resonance Imaging (MRI)
A magnetic resonance image (MRI) scan of the brain identifies large structures in serial virtual sections of the brain. Resonance in physics refers to the tendency of a system to oscillate with greater amplitude at certain frequencies.
Most medical applications of MRI use a strong magnet to set up an efficient resonance frequency for the hydrogen atoms of brain molecules.
Remember the brain is a soft watery tissue and water has two hydrogen in each of its molecules. Therefore, water will give a greater signal than most other brain molecules. As resonance of magnetically excited hydrogen atoms decays a radio frequency signal is emitted.
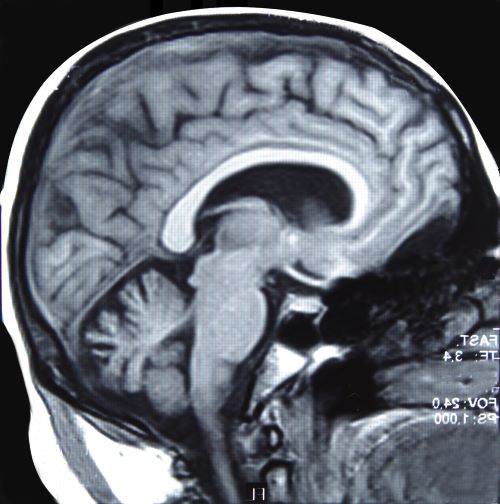
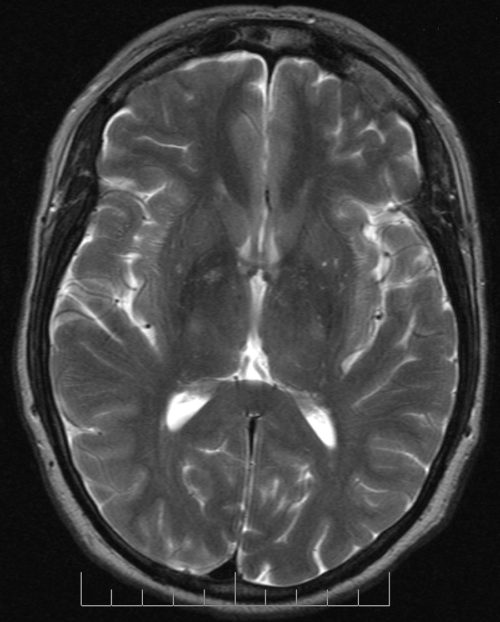
Depending on the timing of the resonance induced by the magnet, and of the radio frequency signal measurements, images are classified as T1 and T2. T1 and T2 acquired images look different.
Areas with high water content like the cerebrospinal fluid surrounding the brain, that is areas with a high percentage of hydrogen atoms, appear black in T1 images, and white in T2 images.
Compare the definition of brain structures in the T1 image to that in the T2 image. Notice also how bright white the cerebrospinal fluid filled ventricles appear in the T2 image.
In brain research studies MRI serves to identify large brain structures associated with neuron activity measured by functional magnetic resonance imaging (fMRI).
MRI is used in conjunction with fMRI for studies of adults. Its main limitations are that it is noisy and expensive for research studies. It is also sensitive to movement of the subject.
Functional MRI
Functional MRI (fMRI) is similar in procedure to MRI, but it measures magnetization of oxygen-rich and oxygen-poor blood rather than magnetization of hydrogen in biomolecules.
Oxygen is carried by hemoglobin molecules in red blood cells. Oxygen-rich hemoglobin is resistant to magnetization. In comparison, oxygen-poor blood is more magnetic. As one form of hemoglobin replaces the other in local areas of brain tissue, a difference in the fMRI signal can be detected.
Neuron activity requires a large amount of energy. Creation of energy rich molecules from glucose uses a lot of oxygen delivered to the tissue by the hemoglobin of red blood cells.
When neurons increase their signaling activity, surrounding astrocytes signal for increased local blood flow to insure an adequate oxygen supply. Oxygen-rich blood displaces oxygen-poor blood in about 2 seconds.
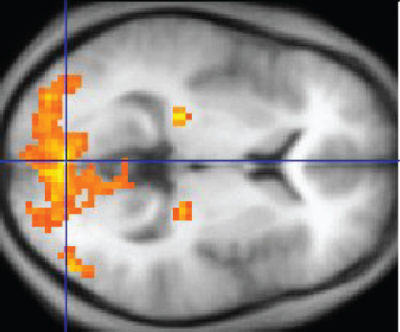
Blood flow changes identified by fMRI are superimposed on MRI data to determine anatomic location of neuron activity.
The relatively slow dynamics of the blood flow response compared to neuron response in 1-2 milliseconds means a signal detected by fMRI is a summation of neuron activity in small tissue areas.
The purpose of this kind of data is to correlate brain activity in multiple areas with a task performed by a test subject. The data provide three-dimensional maps with high spatial resolution of areas working together across the whole brain. Its disadvantage is that it produces very large data sets from up to 100,000 locations at a time that require sophisticated forms of computer analysis.
Magnetoencephalography (MEG)
The magnetoencephalography (MEG) signal is neuron ionic current rather than the oxygenation state of hemoglobin in brain blood vessels.
MEG records magnetic fields produced by currents flowing through brain circuits using sophisticated sensors named magnetometers.
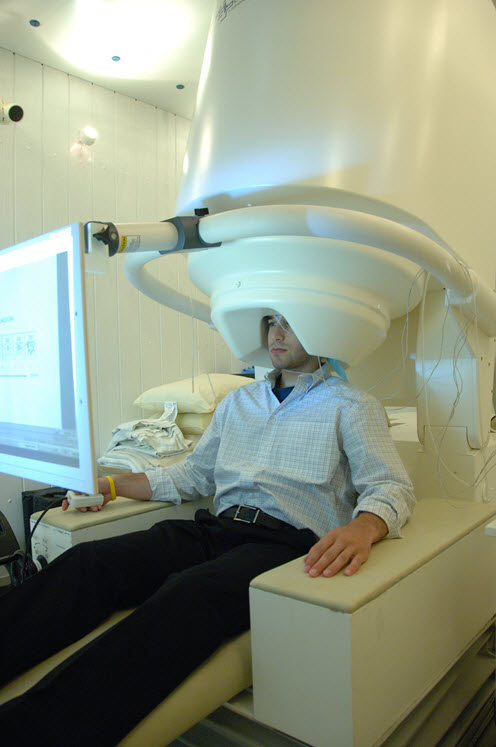
MEG allows precise location of the neuron currents responsible for magnetic fields. It resolves events with a precision of 10 milliseconds or less. Magnetometers reside in a large helmet placed over the subject’s head.
Sometimes MEG is combined with fMRI when mapping a response to an experimental condition. The degree of agreement between data collected with these two techniques varies depending upon the complexity of the neuron circuitry in brain areas responding to the stimulus.
MEG is noiseless and suitable for language studies. Movement does not affect MEG because the helmet contains head tracking sensors. MEG can be used for both adult and children studies.
Its major limitation for research studies is its high cost.
Functional Near Infrared Spectroscopy (fNIRS)
Functional near infrared spectroscopy (fNIRS) takes advantage of the transparency of bone and brain tissue to light in the near infra-red spectrum, 700-900 nanometers.
Most thermal radiation emitted by objects near ambient temperature is in the infrared spectrum. This light energy is invisible to the unaided human eye.
Data obtained with fNIRS are similar to data obtained by fMRI. fNIRS also measures changes in blood oxygenation of small tissue areas. An advantage of fNIRS over fMRI is that it requires a simple helmet device and is therefore far less expensive.
A disadvantage of fNIRS is that near infrared light cannot reach brain areas deeper than 4 centimeters. This limits its use in humans to studies of cerebral cortical neurons.
Functional near infrared spectroscopy is further disadvantaged by its lack of anatomic reference points for the observed changes.
 Click the Brain Awareness Week logo for a calendar of more Brain Awareness Week events around the world. There may be some live events in your local area.
Margaret Thompson Reece PhD, physiologist, former Senior Scientist and Laboratory Director at academic medical centers in California, New York and Massachusetts is now Manager at Reece Biomedical Consulting LLC.
She taught physiology for over 30 years to undergraduate and graduate students, at two- and four-year colleges, in the classroom and in the research laboratory. Her books “Physiology: Custom-Designed Chemistry”, “Inside the Closed World of the Brain”, and her online course “30-Day Challenge: Craft Your Plan for Learning Physiology”, and “Busy Student’s Anatomy & Physiology Study Journal” are created for those planning a career in healthcare. More about her books is available at https://www.amazon.com/author/margaretreece. You may contact Dr. Reece at DrReece@MedicalScienceNavigator.com, or on LinkedIn
Reece Biomedical Consulting LLC Privacy Policy – Click HERE
Featured header image: ©Moonlight Photo Studio, via Shutterstock.com

